• Graphics
  • Figma
  • Research
  • Newsletter
  • About
  • Contact

Zhenia Vasiliev

  • Graphics
  • Figma
  • Research
  • Newsletter
  • About
  • Contact

Sketch for an infographic: CPNI Control Room

tags: sketch, infographic, illustration
categories: photos, research notes
Wednesday 09.23.15
Posted by Zhenia Vasiliev
 

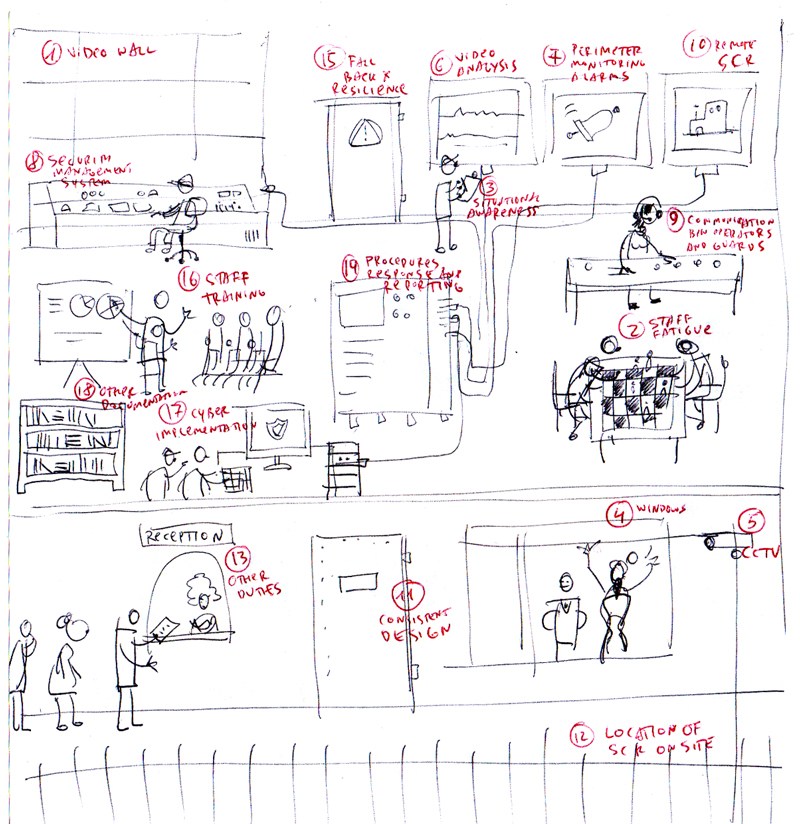
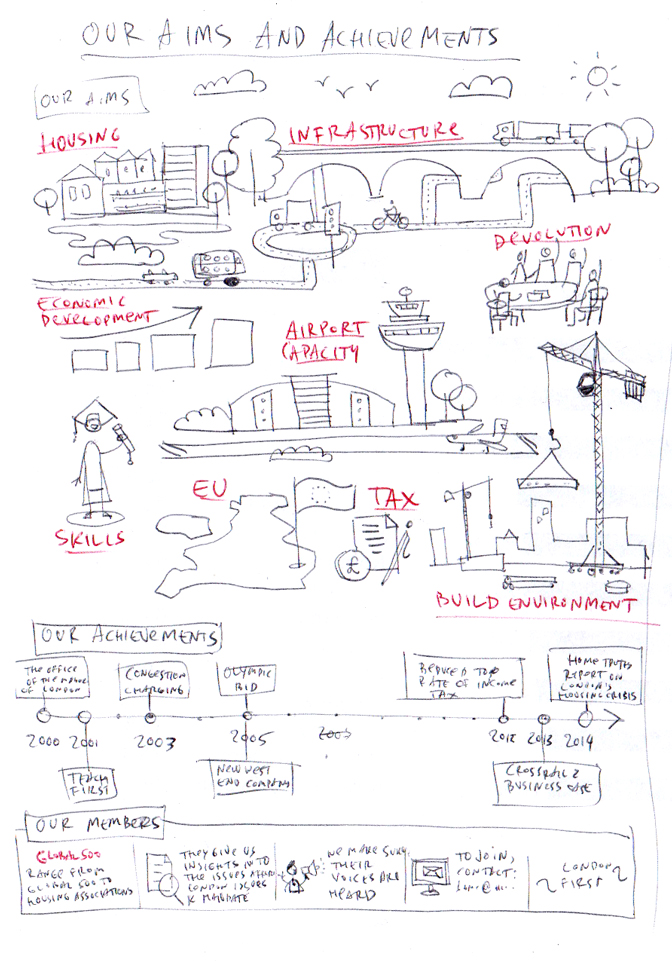
Sketch for an infographic: London First

tags: sketch, infographic, illustration
categories: photos, research notes
Tuesday 09.15.15
Posted by Zhenia Vasiliev
 

Love for dogs illustration

Do #dogs make us and our lives better? I have done an #illustration on the #stats across US. #infographic #doggylove

doggylove


tags: infographic, doggylove, dogs, illustration, dataviz, vector, flat, geometric, piecharts, chart, design
categories: research notes
Sunday 01.18.15
Posted by Zhenia Vasiliev
 

Bones Infographic goes live

If you like Bones series on Fox, here's a new giant infographic all about it we made with Alex Hughes. #BONES @FoxSpecOps3

bones_infographic
tags: infographic, fox, bones, bonesonfox, illustration
categories: research notes
Thursday 12.04.14
Posted by Zhenia Vasiliev
 

Giorgia Lupi of Accurat: Drawing and Designing Data Vis

"The fact then that since I can't have data on paper when I am sketching what comes to mind and designing a data visualization, I feel that it is very helpful to explore visual features and visual aggregations that start exactly from what you have in mind, and that can serve to open questions on the data itself. I see this as a shortcut from your head to the final piece of data visualization."


Three distinct phases for me in my design process:

  • A first phase when I am interested in the main macro categories of data we are analyzing;
  • second phase where I just focus on the singular elements, the entry points that we have, to figure out which shapes, colors, features we might invent to better represent them
  • Final phase where I would structure what I’d expect to finally create, not in illustrator (digital format), but on paper
IMG 9.jpg

Images and text courtesy Giorgia Lupi.
Full article is here. 
Accurat website.

tags: data visualization, infographic, drawing
categories: reference
Sunday 11.30.14
Posted by Zhenia Vasiliev
 

Our Insults infographic goes live!

Which insults are most offensive? Adam Frost and I have looked at the data behind rude words:http://www.buzzfeed.com/adamfrost72/great-british-insults-which-words-are-the-most-of-147xc?s=mobile

tags: infographic, illustration, punk, bullocks, data, books, swearing, words, insults, rude
categories: research notes
Tuesday 11.18.14
Posted by Zhenia Vasiliev
 

The Infographics Atlas has arrived!

With our piece about Hitchcok films in it. Congrats @adamfrostuk and a big thank you to @srendgen!

View fullsize IMG_20141115_101456_2.jpg
View fullsize IMG_20141115_101640_2.jpg
View fullsize IMG_20141115_101811_2.jpg
tags: taschen, hitchcock, illustration, book, infographic
categories: research notes
Saturday 11.15.14
Posted by Zhenia Vasiliev
 

Icons from Pu-Ergh tea pack

tags: iconography, icon, infographic, graphic design
categories: reference
Thursday 11.13.14
Posted by Zhenia Vasiliev
 

Polar chart generator

Let our lives be changed forever! The interactive chart builder that we've been dreaming of for so long has finally been created by the genius of Matt Bentley (and it also exports results into svg's!). chart


Access it now!

tags: data visualization, development, highcharts, infographic, interactive
categories: reference
Friday 06.13.14
Posted by Zhenia Vasiliev
Comments: 1
 

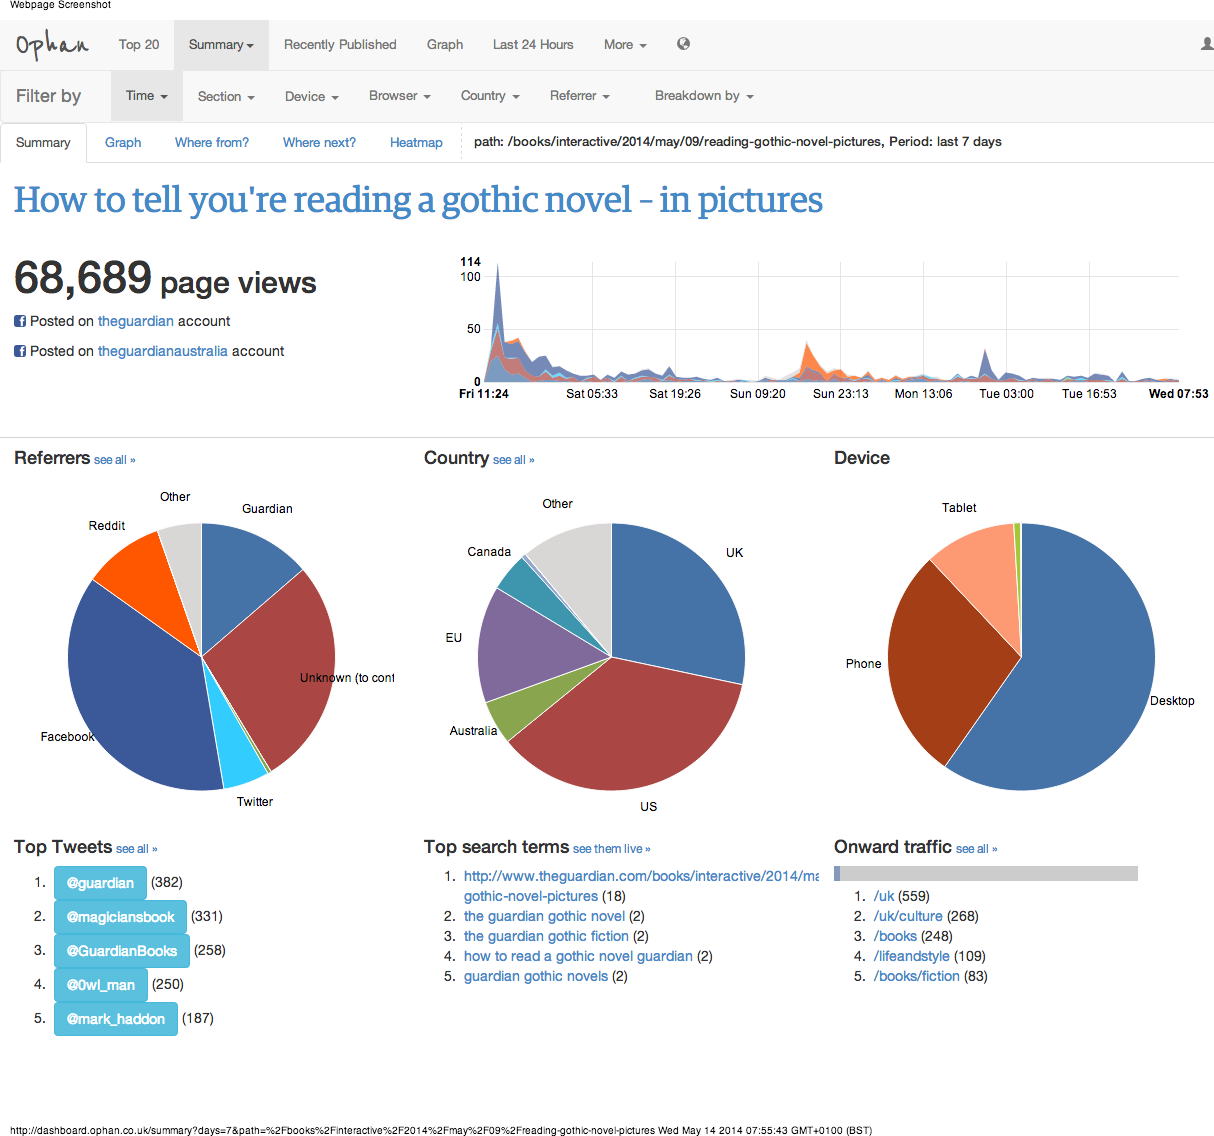
New Gothic infographic on the Guardian - statistics 5 days later

Gothic infographic by Adam Frost and me on The Guardian books - 70K views within 5 days! Plus 10K Facebook shares and 500 Tweets. Is it a lot, though?.. Summary for How to tell you're reading a gothic novel – in pictures

tags: gothic, guardian, infographic, stats
categories: research notes
Saturday 05.10.14
Posted by Zhenia Vasiliev
 

Fainting girl

fainting-girl

tags: animated, gif, gothic, infographic
categories: research notes
Monday 03.17.14
Posted by Zhenia Vasiliev
 

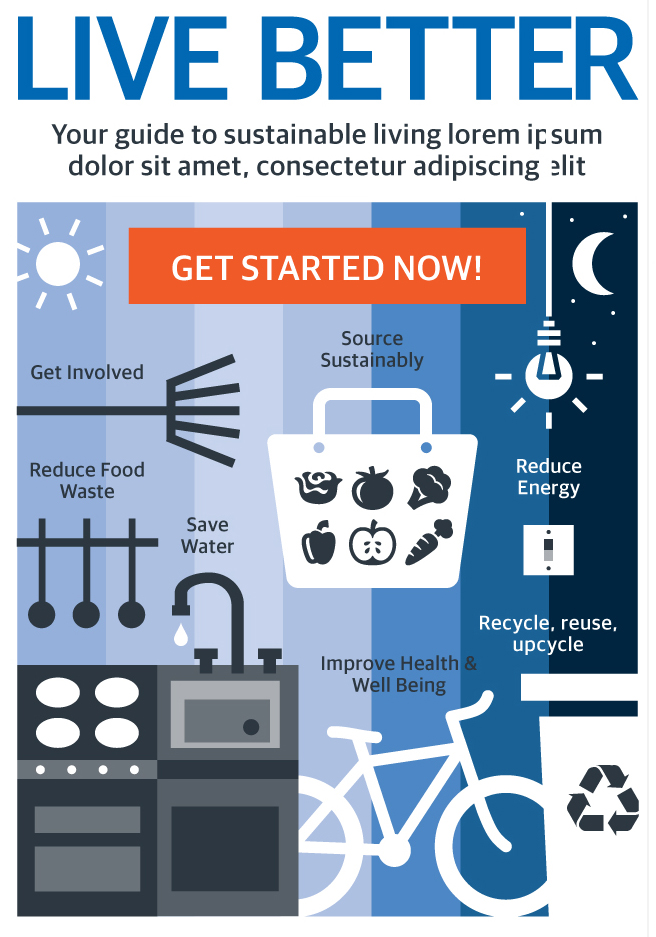
Live better gLabs/Unilever concept image
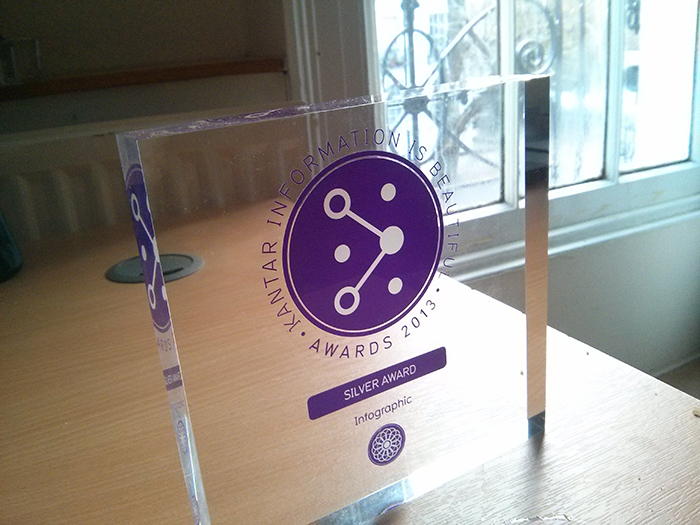
live_better_glabs_3

tags: glabs, guardian, infographic
categories: research notes
Wednesday 01.15.14
Posted by Zhenia Vasiliev
 

IIB Silver Award!

IIB__hitch_silver_award_2013_700px

tags: 2013, Award, beautiful, IIB, infographic, Silver, trophy
categories: photos
Tuesday 12.03.13
Posted by Zhenia Vasiliev
 

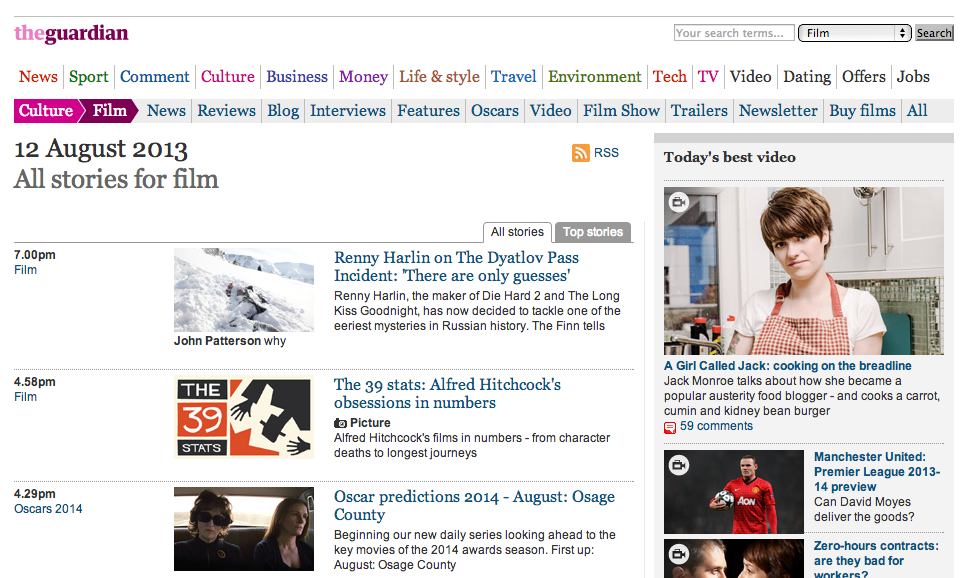
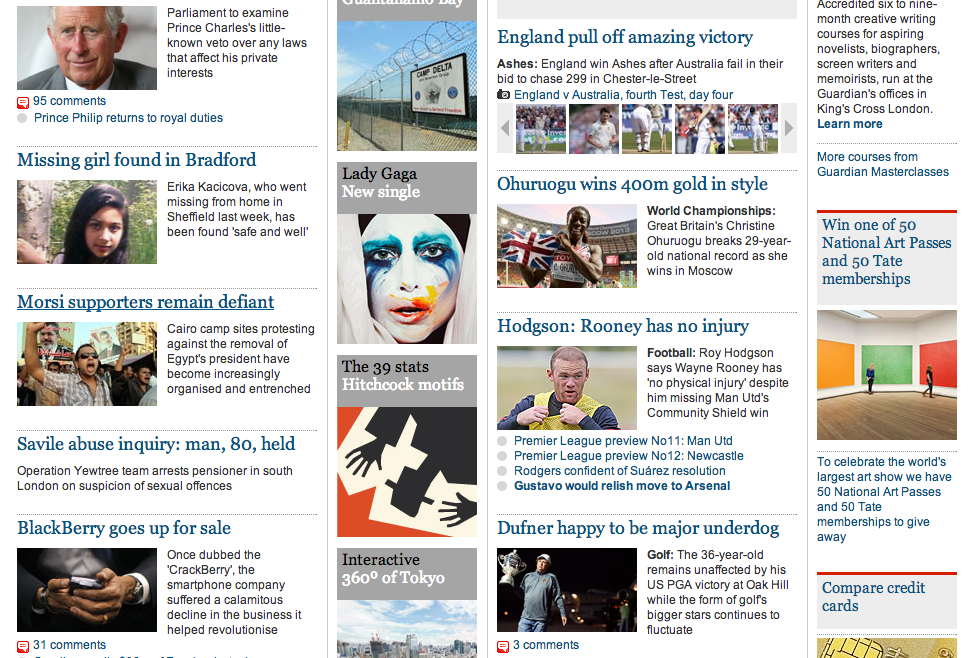
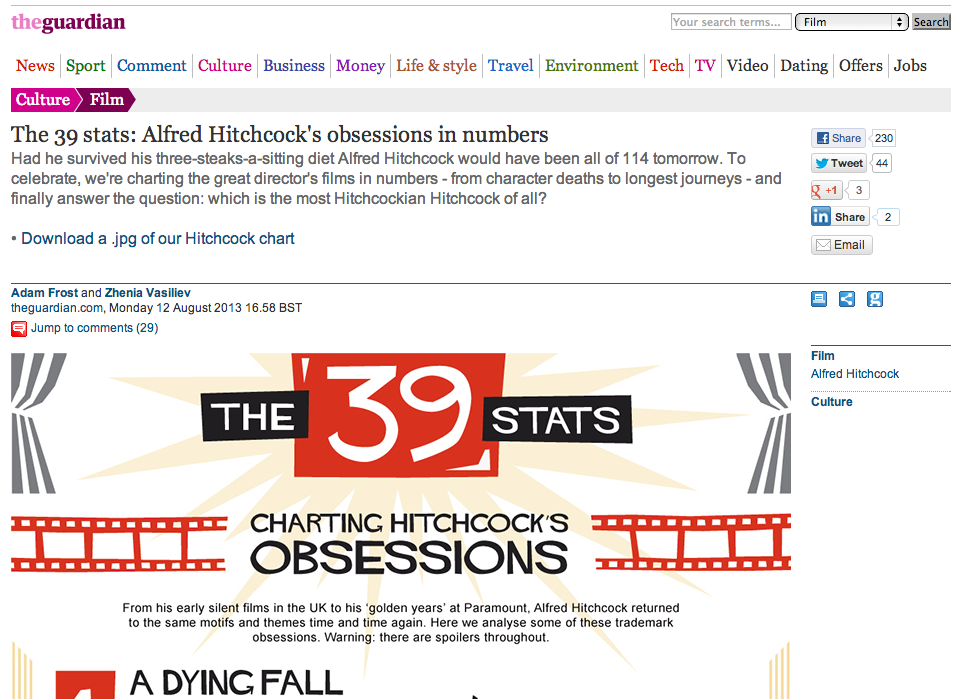
Screenshots of 39 Stats infographic on The Guardian website

Facebook shares reached 2969 on Tuesday 27th August.Link to the graphic on the Guardian website.

The infographic has also been reposted on the following websites: Slate.com
co.create

co.create [again], this time with an interview by John Brownlee

Screen Shot 2013-08-12 at 20.18.45

Screen Shot 2013-08-12 at 20.21.42

Screen Shot 2013-08-12 at 20.22.02

tags: 39 Stats, Adam Frost, hitchcock, infographic, Screenshots, The Guardian, website
categories: reference, research notes
Thursday 08.22.13
Posted by Zhenia Vasiliev
 

Work of chance

A random infogrpaphic created by dragging things out from the artboard:

tags: artboard, chance, design, illustrator, infographic, Work
categories: research notes
Friday 05.03.13
Posted by Zhenia Vasiliev
 

"What's in a name?"

A new infographic by the genius Adam Frost and me on the Guardian website: http://www.guardian.co.uk/news/datablog/gallery/2013/feb/11/whats-in-a-name

tags: Adam Frost, guardian, infographic, name
categories: reference, research notes
Monday 02.11.13
Posted by Zhenia Vasiliev
 

Oscar Wilde's epigrams infographic is on the Guardian.co.uk today!

Adam Frost/Zhenia Vasiliev Here's a link to it on the Guardian website.

tags: Adam Frost, epigrams, Guardian-co-uk, infographic, Oscar Wilde, Zhenia Vasiliev
categories: reference, research notes
Tuesday 11.27.12
Posted by Zhenia Vasiliev
 

Smarthomes business model

tags: business, design, infographic, model, Smarthomes
categories: research notes
Friday 04.15.11
Posted by Zhenia Vasiliev
 

College facts survey infographic

tags: college, design, facts, infographic, survey
categories: research notes
Friday 02.18.11
Posted by Zhenia Vasiliev
 

Facebook compatibility chart

tags: chart, compatibility, design, Facebook, infographic
categories: research notes
Saturday 02.05.11
Posted by Zhenia Vasiliev
 
Newer / Older

Zhenia Vasiliev © 2025