 Logically, users are after numbers, because that where the core information is. Why is there a need to visualize the data?
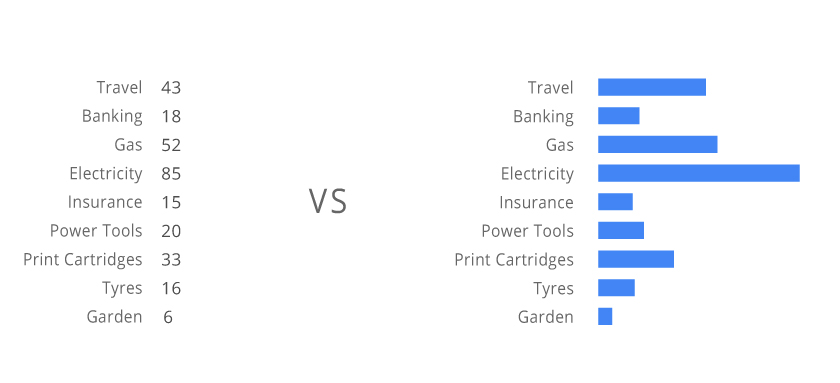
It seems like there is a purely visual mechanism that helps us to understand data in a different way when we look at the image, as compared to just the display of numbers, - a new meaning appears.